Pattern formation is the most amazing process of development. Cells of the late blastula, that individually seem to have identical (totipotent) properties, and that look uniform, are transformed during gastrulation into a patterned embryo with distinct anterior-posterior and dorso-ventral patterns. Repeatedly during development a group of apparently homogeneous cells with similar potential fates gives rise to a patterned structure with highly specialized cell types. Developmental biologists call these homogeneous groups of cells fated to give rise to a patterned structure an "embryonic field". I have already described the example of the late blastula that gives rise to the patterned embryo. There are many other examples that occur as development progresses, e.g., the eye field, the limb field, etc. In each case the embryonic field is defined as a region of cells that is fated to give rise to a particular patterned structure. All cells in the embryonic field seem initially equivalent based on ablation and transplantation experiments, but soon become more restricted in their potential cell fate as the patterned structure emerges and they play their specific part based on their position in that pattern. The major question remains, how does a pattern arise out of an apparently uniform field of cells? There are two obvious possibilities, 1. The patterning signal comes from outside the embryonic field, 2. The patterning signal arises spontaneously from within the embryonic field. We will see that there is good evidence for both sources of signals.
Regeneration is a special case of pattern formation that is much easier to observe and manipulate than patterning during embronic development.. Regeneration occurs to some extent in all metazoan animals. The regenerative abilities of different animals are probably a reflection of their unique evolutionary histories. Evolving and maintaining regenerative abilities must offer a distinct selective advantage for reproductive success. The planarian, hydra, and starfish each demonstrate dramatic regenerative abilities as shown below.
 What is the simplest hypothesis to account for the remarkable regenerative abilities of the hydra? We can perform ablation, isolation, and transplantation experiments to characterized the regenerative abilities of the hydra. I have already told you about the isolation experiments. Since the hydra's pattern regeneration abilities are symmetric, we will only discuss the formation and maintenance of the head. The following transplantation experiments suggest the existence of diffusable morphogens that regulate head formation. In the first experiment, a piece of hypostome is shown to induce a bud when grafted to a midbody location in a host hydra. This suggests that there is some signal released by the head tissue that stimulates the formation of head tissue, but that in the normal head location it is kept in check so that only one head is maintained.
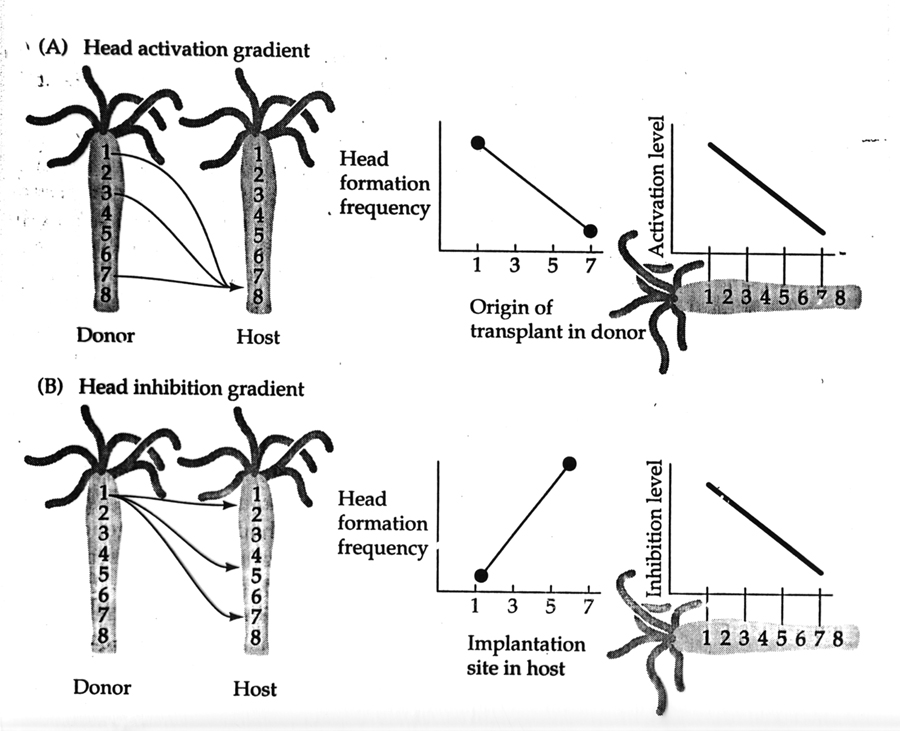
 In the next series of three transplantion and ablation experiments evidence mounts for the existence of a head activator morphogen and a head inhibitor morphogen, both produced by existing head tissue. The first experiment shows that tissue more posterior from the head has less head inducing ability. The second experiment shows that the head itself may be the source of a head inhibitor because if we remove the host's head, now our transplanted tissue rapidly induces a bud. The last transplant to the foot region demonstrates that the tissue posterior to the head can induce head formation and that the source of the head inhibitor gradient seems to be the head itself. The farther away from the head that we place our graft, the more likely we will get a bud.
The following shows the results from systematically grafting pieces from various anterior-posterior locations to the same postior position (zone 8) in a host. If we plot the frequency of head formation against the origin of the transplant in the donor we see a simple linear relationship. We can model this with a single head activator morphogen gradient, suggesting the head as the source. If we now systematically transplant a graft from the same zone in the donor (zone 1) to various anterior-posterior locations in the host and again plot the frequency of head formation (buds) against implantation site in host we fine a nice linear relationship, where head formation frequency is highest at locations farthest from the host head. This can be modeled as a head inhibitor morphogen gradient, again with the head as the source of the head inhibitor.
The simple model of two morphogen gradients, a head activator (P) and head inhibitor (I), can account for much of the observed pattern formation in the hydra. We need only a few more assumptions about the source and characteristics of the morphogen gradients. First, we assume that the head is the source of both morphogens. Second, we assume the head inhibitor diffuses faster, is more labile and degrades faster than the head activator. The figure below shows the basic model. In an intact animal the head secretes a head activator (P) and head inhibitor (I). The concentration of the head inhibitor is greater than head activator all along the body axis. However, when the head is cut off, there is no source of either head activator or inhibitor. The inhibitor is more labile and degrades faster, so where the head activator concentration is greatest (nearest the head) is where it first becomes greater than the concentration of head inhibitor (graph 2). With the activator levels above the theshold for inhibition, a new head begins to develop and the concentration of head activator increases (graph 3). The new head produces not only head activator, but also inhibitor so the concentration of inhibitor soon rises above threshold for new head activation (graph 4). Thus one and only one head regenerates we are back to the steady state condition (graph 5).
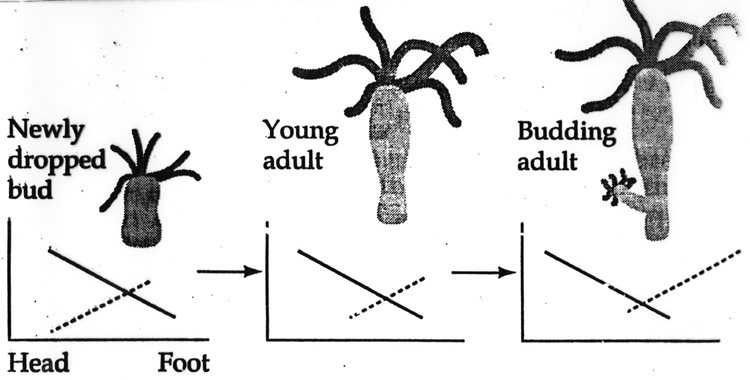
This model also nicely accounts for the normal position of bud formation. We need to make one more assumption for the model to work. We need to assume that all hydra tissue has the capacity to autonoumously produce head activator when released from inhibition by the head inhibitor. Now you can see how as the hydra grows a region near the budding zone will eventually escape from the head inhibitor gradient. Remember that I said head and foot formation could be accounted for by the same model. Thus we make the same molecular assumptions; the foot is the source of a foot activatior and a foot inhibitor morphogen gradients. The foot inhibitor diffuses faster and is more labile than the foot activator. The figure below graphs the levels of head inhibitor and foot inhibitor as the hydra grows. It illustrates that the budding zone is the body region where the hydra cells first escape from head inhibitor. Buds form "heads" first because they escape from head inhibition before foot inhibition.
The hydra model illustrates the very simple assumptions needed to account for a system that self organizes a specific pattern. (see this Review for identification of morphogens)
The Reaction-Diffusion Model was put forth by Alan Turing (see this entertaining RadioLab podcast HERE and a more rigorous SCIENCE REVIEW). A formalized general description of this simple self organizing model is described and illustrated below. The "Reaction-Diffusion" model is very simple, but very powerful in accounting for self organizing systems. The assumptions of this general model very similar to the model we made for hydra regeneration. We assume that all cells of our embryonic field have the capacity to autonomously produce a slowly diffusing activator (P). The activator (P) stimulates its own production (autocatalysis) and also stimulates the production of inhibitor (S). (S) diffuses rapidly and inhibits the production of (P).
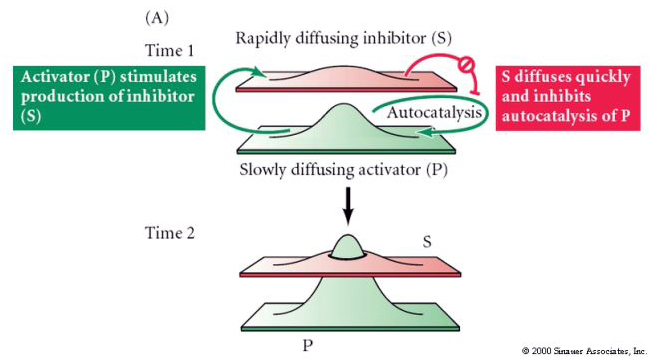
Figure A illustrates how this system could self organize to produce one peak of activator (P) surrounded by a "lake"of inhibitor (S). Notice how either changing the field size or changing how far the inhibitor effectively inhibits (P) you can get one or more peaks of activator (P). Also notice that it doesn't matter where the peak or peaks initially form in the field. The activator peaks (P) will "move" until they minimize their exposure to the inhibitor (S).
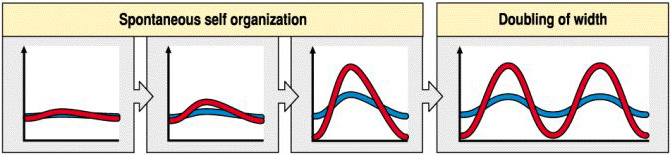
Notice how in figure below when the field size increases (grows) by a factor of two that we see the growth of another peak of activator (P). Developmental biologists talk of number and space regulating systems. You have one head per embryo. That is a number regulating system. However, you will increase the number of hairs on your arm as you grow. New hairs are added as space becomes available. We call this a space regulation system since it is not the number of hairs that is regulated but the spacing. Notice that when the inhibitor diffuses far relative to the field size we get a number regulating system, however when the inhibitor diffuses only a short distance relative to the field size we would describe it as a space regulating system.
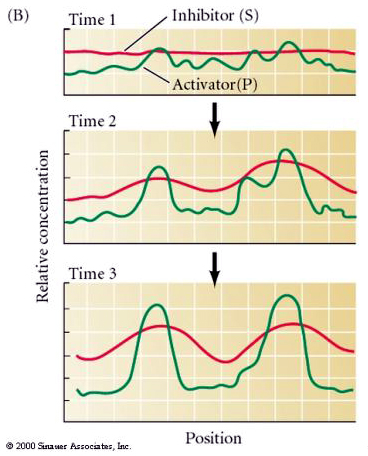
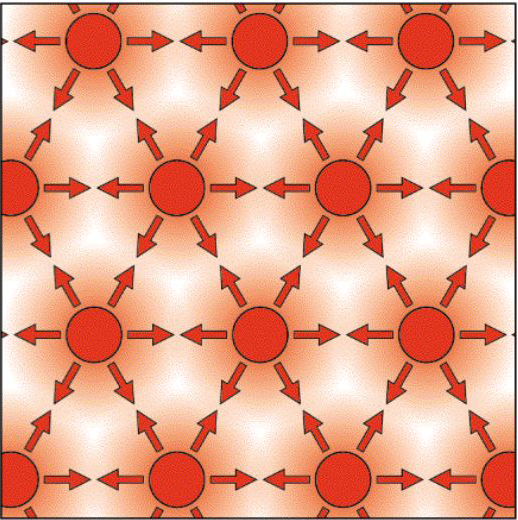
Notice in the next two illustrations that the inhibitor diffuses only a short distanct relative to the field size so you develop many evenly spaced peaks of activator.
This trys to illustrate the activator peaks (red circle) surrounded by diffuse halos of inhitor. This gives you a nice equally spaced pattern that increases the number of peaks as the field grows.
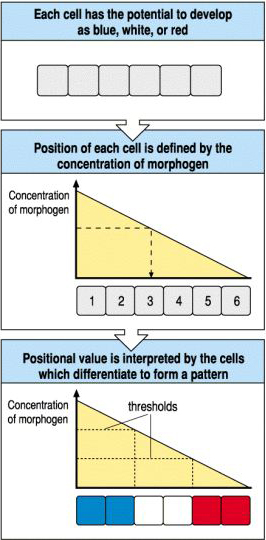
You have seen how the simple assumptions of the reaction diffusion model can lead to the self organization of complex gradients. Morphogen gradients can thus be self generated within an embryonic field or imposed from a nearby tissue. The next issue we want to explore is how cells in an embryonic field can differentially respond to a morphogen gradient (whether generated intrisically or extrinically). The simple analogy we will use is called the "French Flag" model.
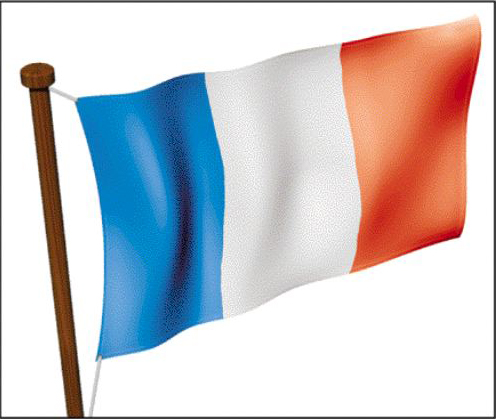
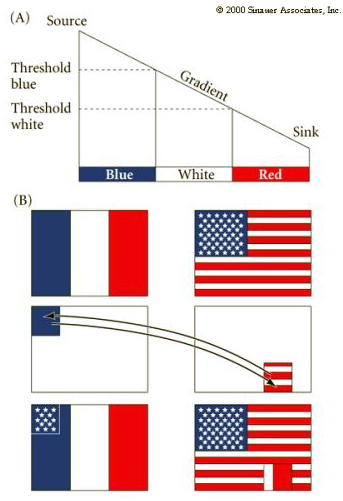
Imagine an embryoic field consisting of 6 cells. During development the anterior 2 cells express a blue pigment, the middle two a white pigment,and the posterior two a red pigment. We can explain this with a simple linear morphogen gradient by assuming that cells can respond differently depending on their position within the morphogen gradient. We assume that at a threshold value or above the anterior cells turn on a gene for the blue pigment, the middle two cells are exposed to a threshold value that activates the gene for white pigment, and below a certain threshold all cells express the red pigment.
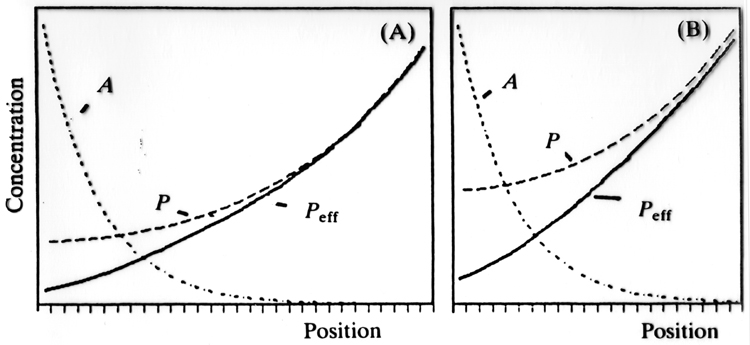
One practical problem with this system is that it is not very good at compensating for differing field sizes. A double antagonistic gradient helps with this problem as illustrated below. Peff always goes from about zero to 100% even if the field size changes significantly. This is a real problem as I discussed in class. Embryos can vary in size considerably depending on maternal resources, but you don't want to change the percent of the embryo you allocate to each body region.
This is also important in regeneration and growth. The figure below shows how you must somehow maintain relative positional values during morphallaxis (regeneration without the increase in cell number) and during epimorphosis (regeneration with replacement growth in cells number).
Another important point to understand is that different cells (and even the same cells at a different time in development) can respond to the same morphogen gradient in different cell specific manners. This is illustrated below where the upper left corner of the French flag is exchanged with the lower right region of the American flag. Notice that each transplanted square of flag responds appropriately based on its position in the morphogen gradient, but each also maintains its French or American identity. Thus the transplanted square of the American flag develops the star patterned based on its position in the gradient, but makes the American star pattern and not the French solid blue appropriate to the French host flag.
We will discuss specific "real" morphogens on how they affect embryonic fields later in the course, but I would like to briefly remind you of how genes are regulated since it is differential gene expression that underlys cell differentiation during development and the differential response of cells in an embryonic field. Imagine expression of protein A, B, C, and E causes a cell to differentiate as a muscle cell. Gene X would be considered a master regulator gene for muscle differentiation. Gene X encodes a transcription factor that activates gene A, B, C, and E, while at the same time repressing gene D.
The main feature of genes that I want to focus on is the regulatory region where regulatory proteins bind to affect gene transcripton. We will define it as the promoter region plus a varible amount of 5' DNA that includes enhancer regions. This is an oversimplification, but will do for now. The promoter region regulates gene transcription by affecting how well the transcriptional complex forms and stimulates RNA polymerase activity.
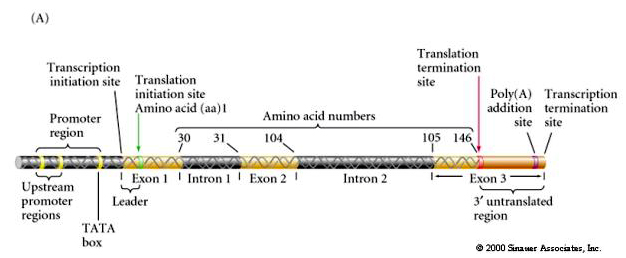
RNA polymerase plus many coactivators, activators, and repressors act together to regulate the amount of gene transcription and thus gene activity. Since DNA is flexible, DNA sequences that represent enhancer elements can be 1000s of base pairs distant from the promoter region. The number of enhancer elements can be quite large (How Large?) and interact in complex ways. We call proteins that regulate the activity of promoters transcription factors. Ultimately, a morphogen gradient must affect gene activity through the activation or inhibition of transcription factors. In fact, we will see that in the simplest case during fly development transcription factors themselves can act directly as morphogens. The nuclei of the early fly embryo exist in a syncial blastoderm. There are no cell membranes separating the nuclei. Thus transcription factors produced by one nucleus can simple diffuse directly to nearby nuclei to affect transcription.
This is a very simple set of interactions between two transcription factors to illustrate the how complex regulator interactions can arise from differential binding of transcription factors to each other and to themselves. You can easily see how opposing gradients of Jun and Fos would lead to a complex pattern of AP-1 gene regulation.